Digital credit went from zero to $14B in 15 months — but how do you price its risk? This paper uses the Bitcoin options market to decompose digital credit yield into three parts: the risk-free rate, the market cost of hedging Bitcoin price risk, and the residual premium for everything else.
Click any page to take a closer look at what's inside the paper.
Download the full research paper for free
A quantitative framework for pricing digital credit risk — written for analysts, allocators, and treasurers who need to value STRC, STRF, STRD, STRK, and SATA with objective, market-based inputs.
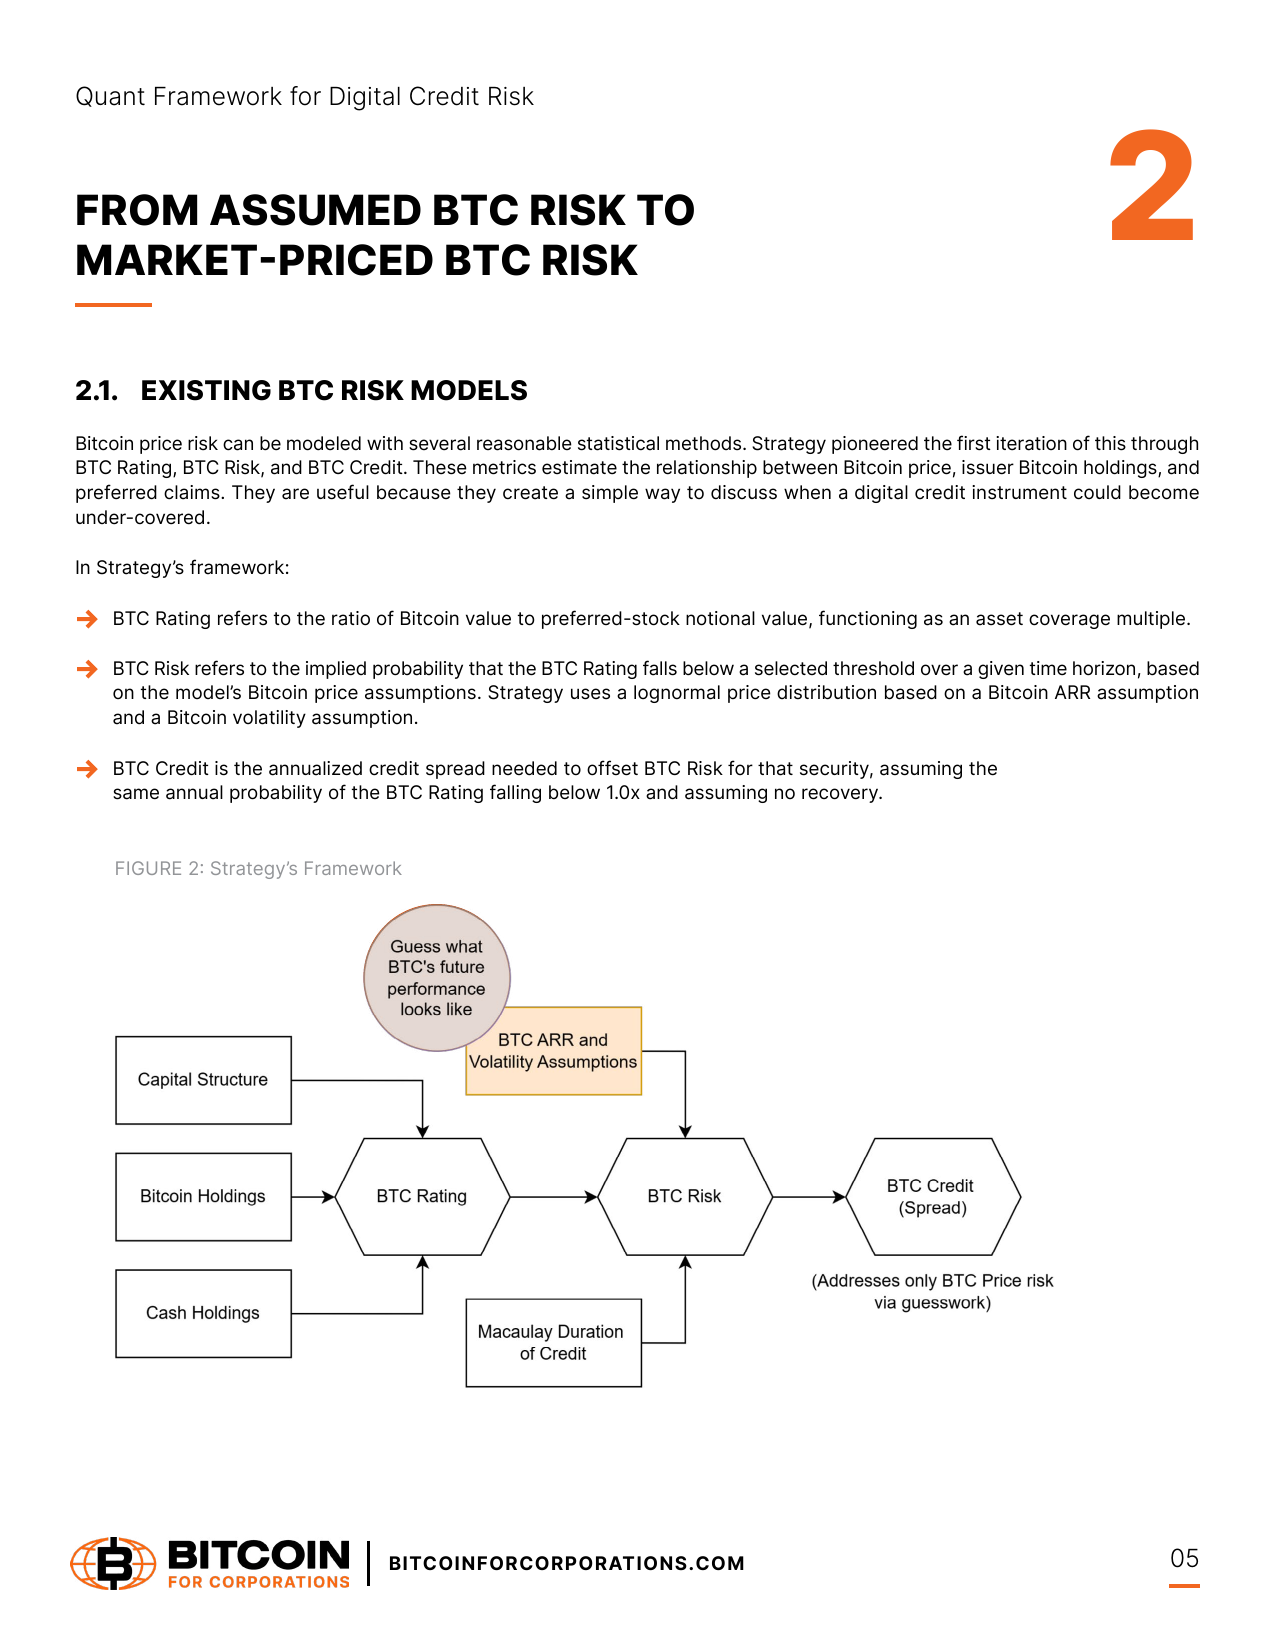
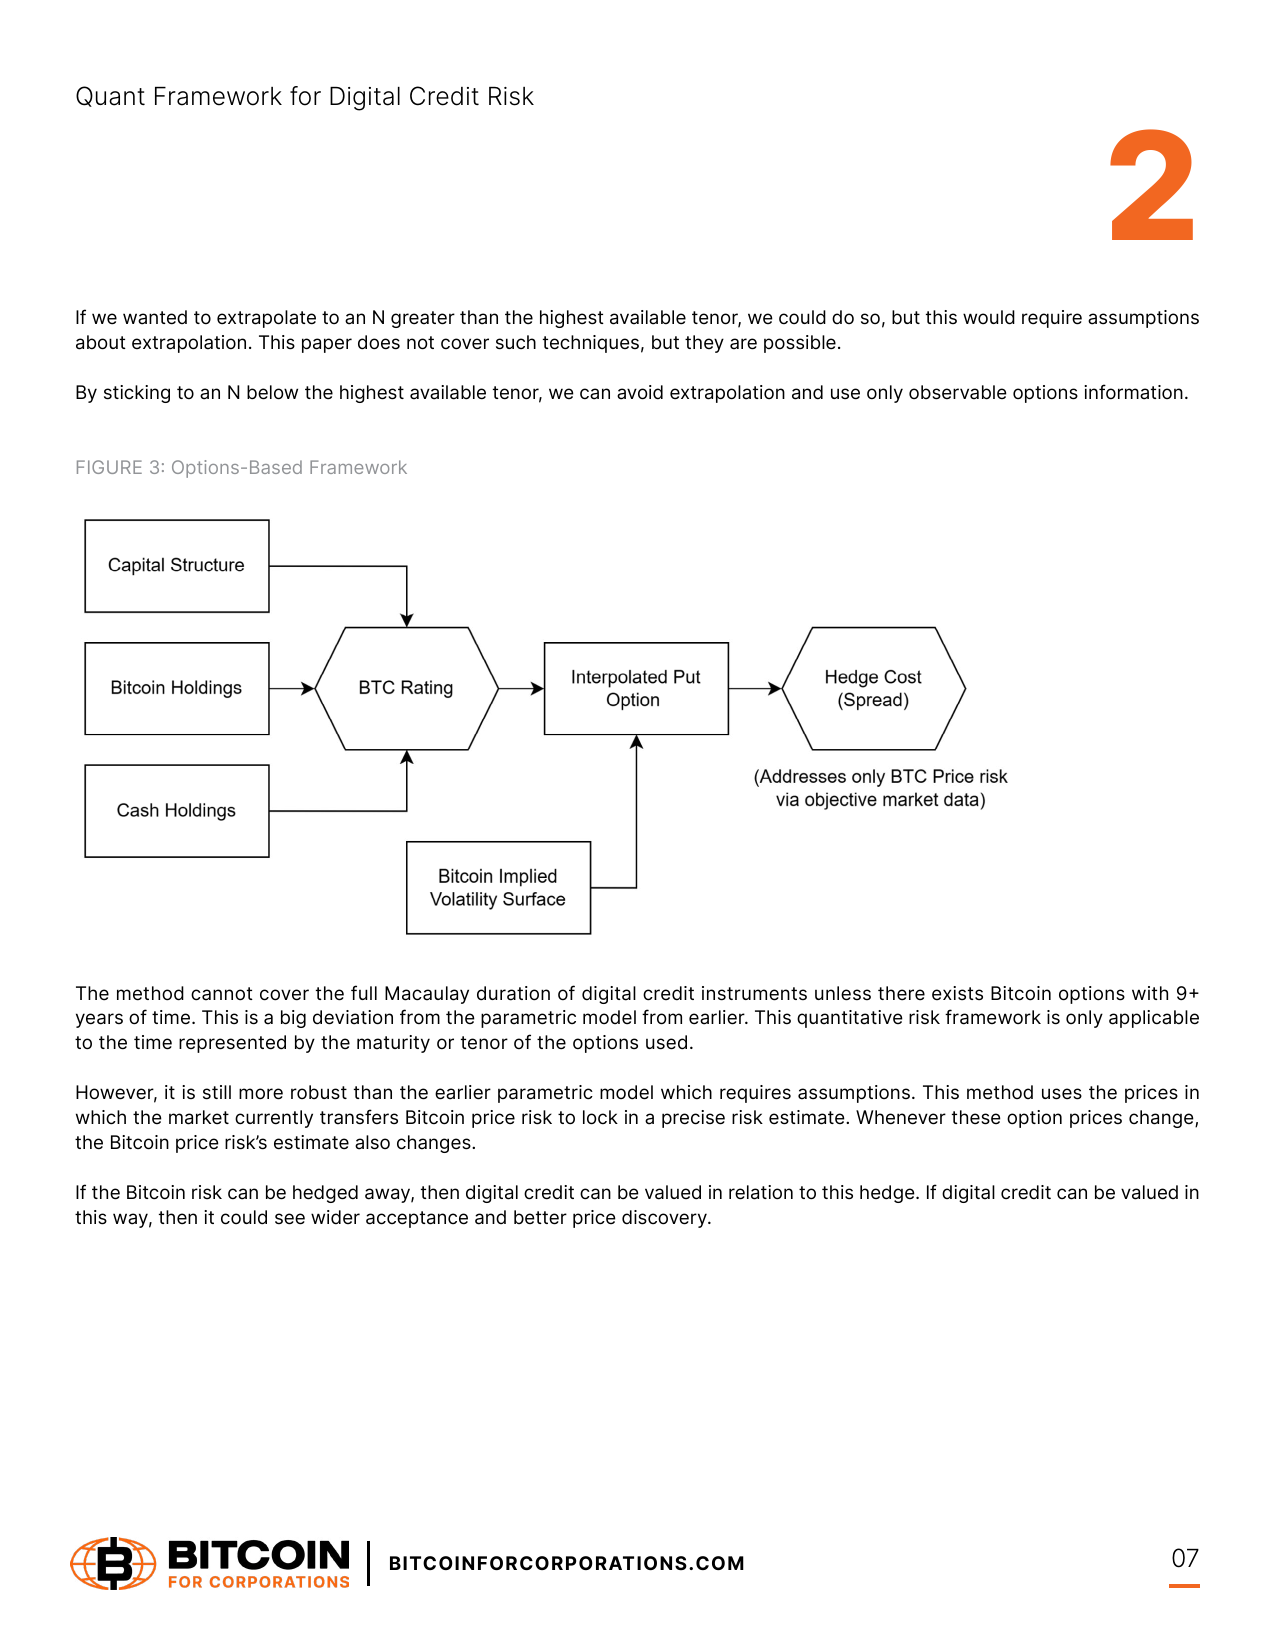
Why the Bitcoin options market beats parametric ARR-and-volatility models for measuring Bitcoin price risk — real prices instead of guesses.
Use the IBIT volatility surface to price a put at the exact strike where coverage hits 1.0x — the market-implied cost of removing Bitcoin price risk.
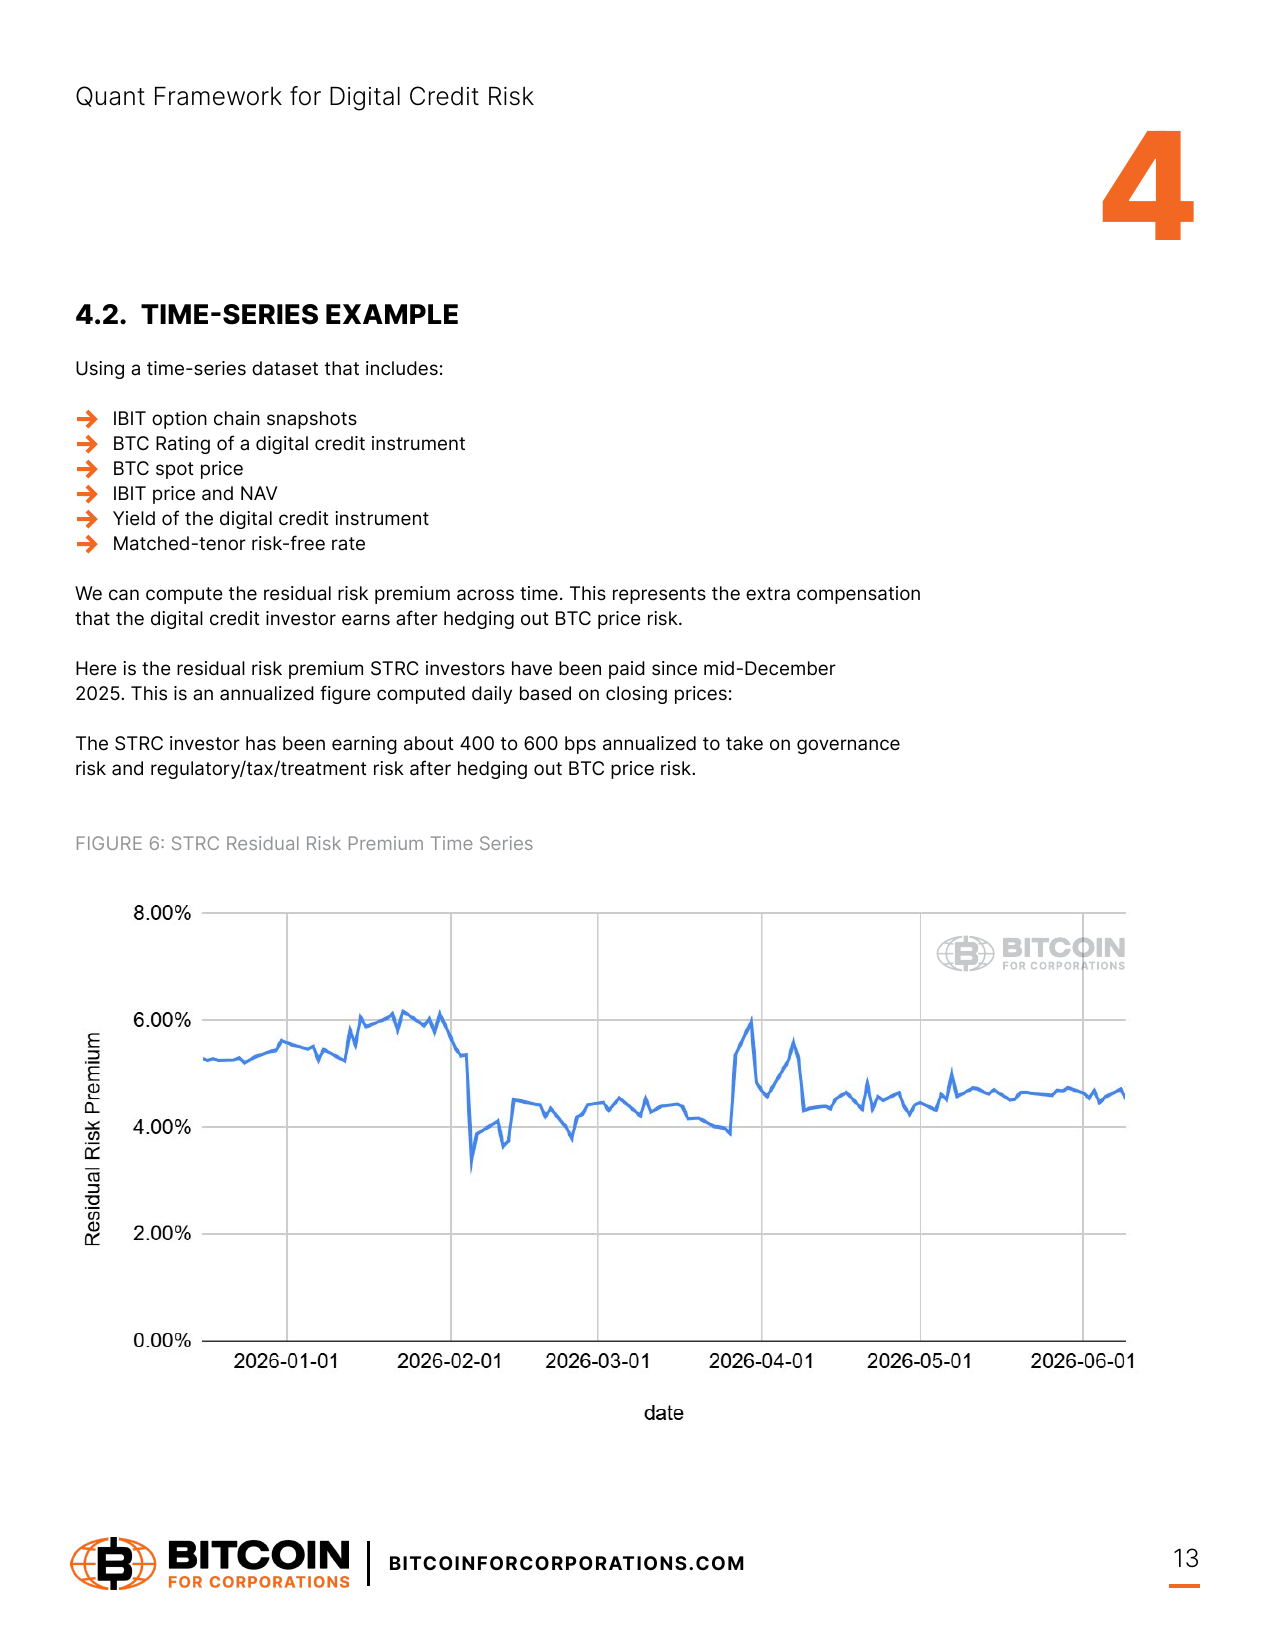
Split any yield into three parts: the risk-free rate, the BTC price-risk hedge cost, and the residual premium for governance and regulatory/tax/treatment risk.
Instrument-by-instrument dividend, arrears, and control rights across STRF, SATA, STRC, STRK, and STRD — plus scenario-pricing BTC-contingent governance stress.
What Bitcoin options can and can't price — plus the price-adjusted BTC Rating for instruments trading away from par, and how operating businesses and cash burn reshape asset coverage.
Why digital credit's own options are too illiquid to hedge with, how to value an instrument before buying, and the yields at which STRF, STRC, and STRD would be overvalued.
A rigorous, worked-through framework — formulas, figures, and commentary you can apply to real instruments.
Critical insights every investor and allocator needs to know.
Digital credit yield splits cleanly into the risk-free rate, the market-implied cost of hedging Bitcoin price risk, and a residual premium for governance and regulatory/tax/treatment risk.
Instead of assuming Bitcoin ARR and volatility, the framework reads the live IBIT options surface to price a put at the exact strike where coverage falls to 1.0x.
The framework splits a live instrument's yield into its risk-free rate, BTC price-risk hedge cost, and residual premium — so investors see exactly what each part of the yield is paying for.
Across the data series, investors look over-compensated for the risk they take — the asset class appears undervalued relative to the objective, options-implied floor for that risk.
A quantitative framework for pricing digital credit risk with objective, market-based inputs — yours to read instantly, free.