

The Leveraged Setup (Important Context)
Something paying 11.5% while promising to stay at par will attract leverage to squeeze out more returns. This is likely done using margin in brokerage accounts. There are also a number of DeFi protocols that are doing things to this effect (Saturn, Apyx, and auxiliary looping ecosystem).
STRC was the most natural digital credit instrument to leverage in this manner because it is the most liquid and the biggest. Strategy also has a longer track record than Strive, so it is the natural vehicle to express a levered digital credit carry trade.
The game theory for everyone doing this is to try to get out before a significant drawdown. This way they keep the extra yield earned by running a carry strategy (long STRC via cheaper funding sources like margin) without realizing a big loss that cancels out those gains.
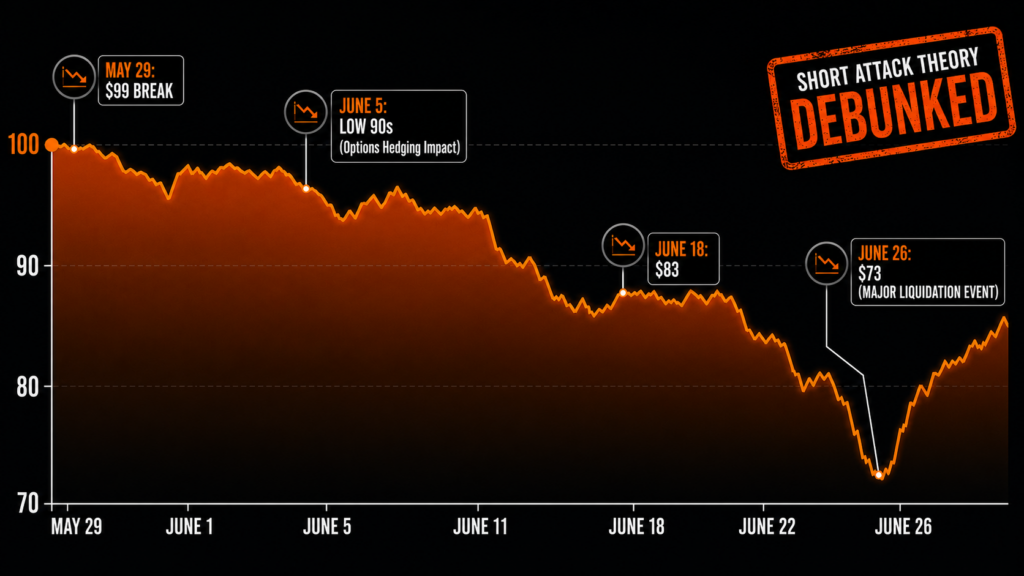
Once the shares fell below $99—which was clearly the case by June 1—we are in a territory where people are starting to head for the exits. This allows the selloff to deepen, which eventually starts to affect more leveraged long positions and force them to start reconsidering an exit strategy.
Now, initially, this drawdown doesn’t have to cause margin calls because it could just be longs hitting their own stop losses and exiting gracefully. The earlier exits clearly were better off than the later exits, but the point is that major pain did not occur in the early stage. This refers to when the first leg went down to low 90s—around June 5.
That said, the intraday price action of June 18—and the third phase of the crash in the following week ending Friday June 26—was much more likely to be margin call related because of its speed and how exceptionally bad STRC was performing compared to comparable instruments.
Why Short Attack Is Probably Wrong
Given the data, it is unlikely that STRC was the victim of a short attack carried out by directional traders. Short volume ratios reported to FINRA were consistent before and throughout the entire drawdown. In fact, short volume ratios for STRC were much lower than that of SATA.
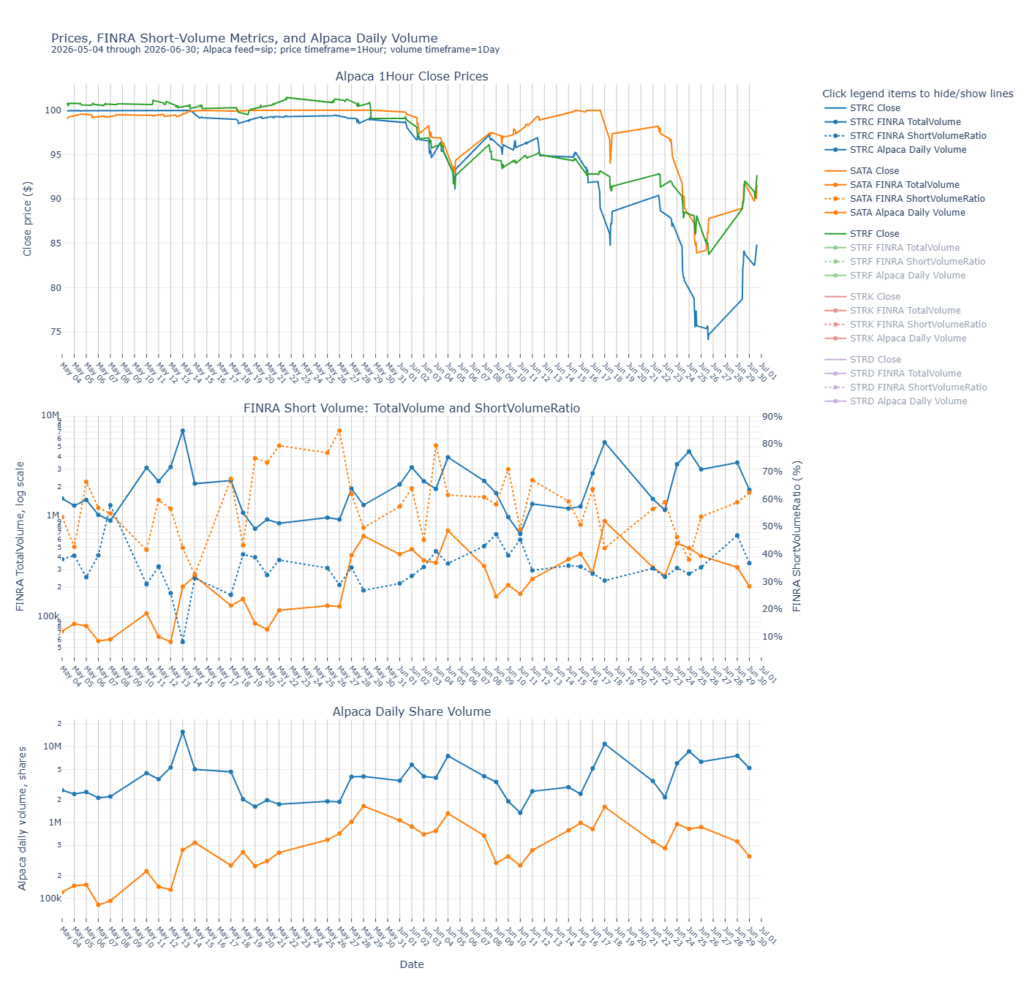
STRC’s short volume ratio (shown in the dotted blue line in the middle chart) climbed during the initial selloff to the low 90s (June 1 to June 5) but actually fell as the selloff intensified into the second phase, which culminated in an intraday bottom at around $83 on June 18. After this point, throughout the entire fall to the $73 bottom, the short volume ratio stayed flat.
Options Positioning
STRC’s options market really opened up over the course of June. Notice the dramatic rise in open interest starting after June 1.
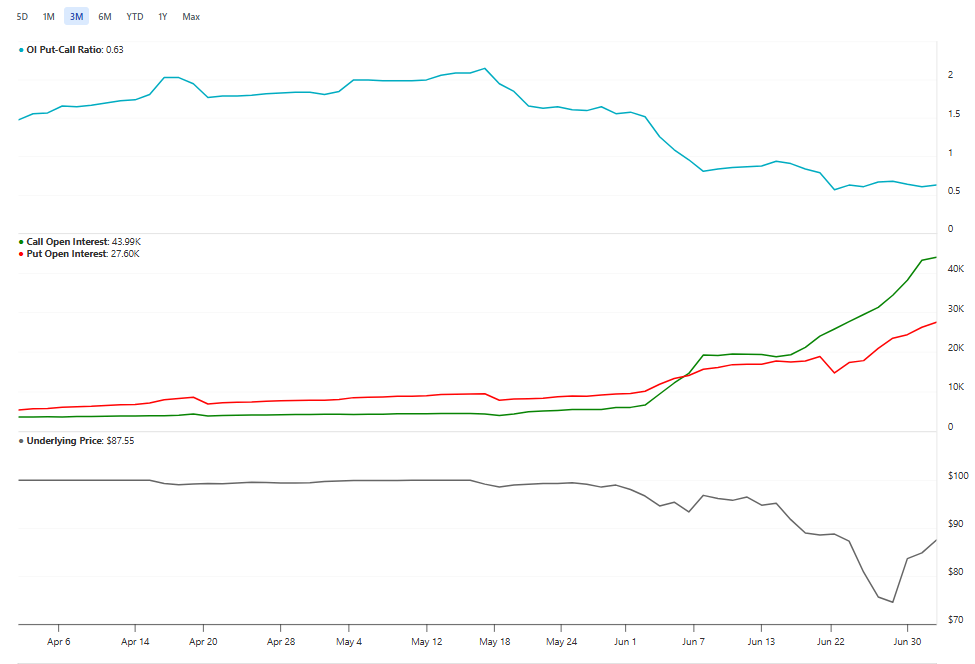
The first leg down for STRC coincides with a jump in both STRC call and STRC put open interest, with calls jumping much more than the puts. This is also confirmed in the drop in the OI put-call ratio.
So from these charts we know a few things:
- Lots of STRC option positions were opened. In fact, from June 2 to June 6, the call OI almost tripled and the put OI increased by over 50%.
- This jump in open options positions coincided with the first leg down to the low 90s (which ended June 5).
- This jump in OI during the first leg down was also the largest jump in OI in percentage terms. During a time of lower volume, hedging behavior by market makers will be able to affect the spot price.
- In the second leg down to $83 (which ended on June 18), OI drifted slightly upward but was mostly flat.
- In the third leg down to $73 (which ended on June 26), call OI roughly doubled over the course of a week.
We cannot know what was the exact exposure for market makers but we can make some guesses based on reasonable behavior we would expect from market participants
Directional traders (i.e., those who are not market makers) will buy puts to either bet on a deeper crash or, if they are leveraged long STRC shares, protect their downside. Directional traders may also sell covered calls on their shares or write naked calls. The increase in implied volatility makes the call premia attractive. And in-the-money or at-the-money calls serve as a good buffer should the shares go further down. Calls were clearly the main thing traded, as seen in OI trends.
As the price went to and below $95 on June 4, this perfectly coincided with the middle of the largest rise in call and put OI. This also makes sense because $95 was a key options strike and transacting at that strike was trading the at-the-money options, which gives maximum gamma. Consider also that this was exactly when the STRC short volume ratio was rising, between June 1 and June 5. Given my approximation of gamma and delta exposure, about 3–5% of the daily volume could have been options-related hedging.
The rise in call sales and put purchases at the $95 strike around June 4 led to the delta hedging behavior that helped take the price to $91 intraday on June 5. This was the first leg down.
The price stabilized between $92 and $96 over the next week before starting to collapse on June 16, where STRC closed at just under $92. The second leg down from June 16 to June 18 was very likely from leveraged long positions getting forced out rather than options market behavior. And this is the same for the third leg down that ended on June 26.
The most violent, final leg of the June crash was probably not due to options hedging flows because even though OI doubled over a few days, the short volume ratio did not change much. Thus it is likely that throughout this third leg, most option sellers found other option buyers.
What Happened End To End
Here is a likely situation, from putting together everything mentioned so far:
- May 29: STRC was below $99 and some longs were heading for the exit. This pushed the price lower as we moved into June.
- June 2: More longs head to exit because the price is at $96.50 during the morning session.
- June 3: Put buying and call selling (clustered around $95 strike) especially as the price dips below $95.
- June 4: Slight relief rally back to $96. This is where directional traders start to aggressively increase options OI. Lots of shorting from market makers from this and the prior day leads to the short volume ratio increasing on the FINRA dataset.
- June 5: Early liquidations and options flows completes the first leg down. Finish at $93.40.
- Next week until June 15: Choppy trading. Uncertainty about returning to par or another leg down. Put OI climbed with short volume ratios. The conservative traders are using the bounce off $93 to buy protection. Options dealers are hedging.
- June 16: Start of the second leg down. The morning session shows $93 (the prior support) and it’s below $92 by close. Support is broken.
- June 17: Goes to $89. Now the laggard carry trades are unwinding.
- June 18: Morning session crash down to $83 is caused mainly from forced liquidations. Other traders step in to bid the price back to $88. Puts closed to pocket the profit. This is also the option expiry and many options were rolled to the next monthly expirations.
- June 22: After the three-day weekend (Friday June 19 was closed market), this day was relatively calm. It is possible some traders leveraged up hoping for a quick bounce back to $100.
- June 23 – 26: Third leg down. Even more leverage is liquidated and washed out.
- Price returns very quickly to $85 after the weekend. On July 1, STRC closes at $87.46 after touching $89 intraday.
Post-Mortem Closing Thoughts
The final thing we will leave you with is the performance of the five digital credit instruments over the course of June. We start measuring from May 4. STRK and STRD suffered the most. This is reasonable because STRK’s convertibility into MSTR caused it to suffer a lot and STRD has non-cumulative dividends which clearly becomes higher risk in capital structure stress.
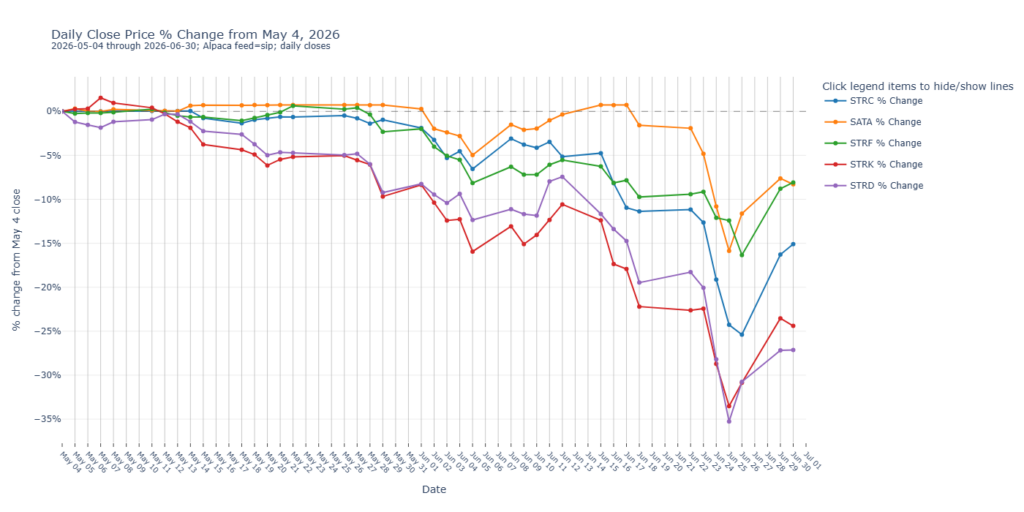
What is striking is the comparison between STRF, SATA, and STRC. Despite SATA having much lower asset coverage than even STRD, it suffered the least throughout June. In fact, it was still trading at par until basically the last day of the second leg down for STRC. SATA showed remarkable resilience despite being riskier.
We believe the best explanation for this series of events is that leverage was almost exclusively concentrated onto STRC due to the carry trade mechanisms discussed earlier. As the risk limits and margin calls came in, it created a large liquidity event where the market had to absorb a lot of forced selling.
Disclaimer: This content was prepared on behalf of Bitcoin For Corporations for informational purposes only. It reflects the author’s own analysis and opinion and should not be relied upon as investment advice. Nothing in this article constitutes an offer, invitation, or solicitation to purchase, sell, or subscribe for any security or financial product.